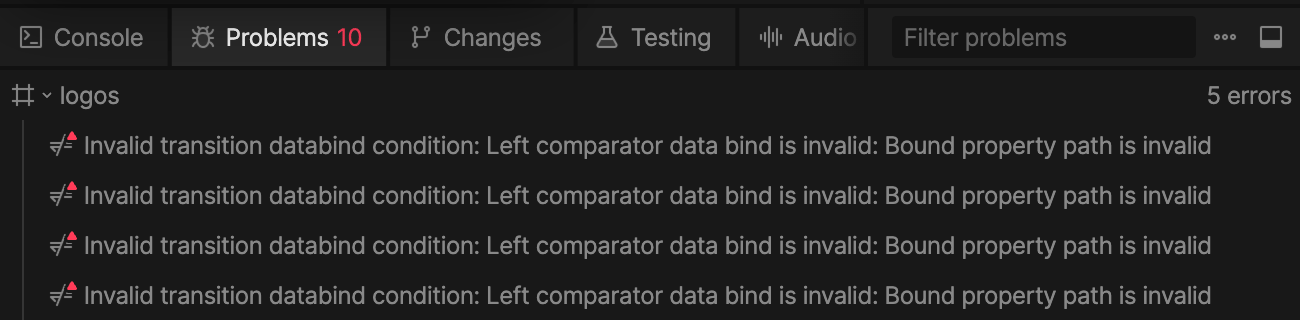
Tabs
The Debug Panel is organized into tabs.- Console - view script logs, runtime errors, and State Machine activity.
- Problems - view code issues, broken bindings, validation warnings, and other problems in the file.
- Changes - review pending changes from the AI Agent.
- Testing - run test scripts.
- Audio - preview audio assets and create clips.
Console
The Console shows output from scripts and State Machines. Use the sidebar in the Console tab to switch between the script console and the State Machine console. Use the Console options to clear the console, clear the console when playback starts, or copy console output.Script Console
The script console shows output from scripts, includingprint() messages and runtime errors.
See Script Console for more information.
State Machine Console
The State Machine console shows State Machine activity during playback, such as entering a state or taking a transition.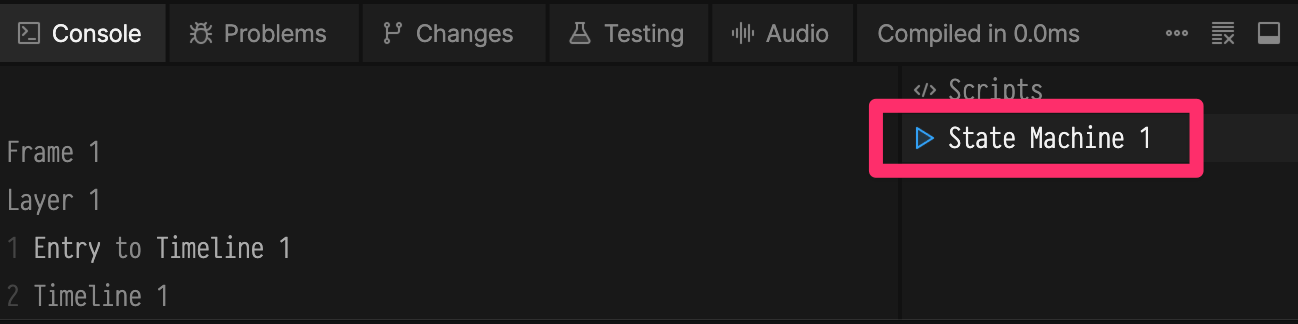
Problems
The Problems tab lists issues found in the file. These can include code problems, broken data bindings, validation warnings, or problematic State Machine setup. Use the Problems options to filter problems, show or hide warnings, and include non-script validation. Click a problem to open the affected code line, binding, State Machine item, or related editor location. See Script Problems for handling script-related problems.