> ## Documentation Index
> Fetch the complete documentation index at: https://rive-debug-panel.mintlify.site/llms.txt
> Use this file to discover all available pages before exploring further.
# Interface Overview
> Rive's interface only shows what is needed when you need it. It is divided into a few main panels, which are described below.
export const YouTube = ({id, timestamp}) => {
const videoSrc = timestamp ? `https://www.youtube.com/embed/${id}?start=${timestamp}` : `https://www.youtube.com/embed/${id}`;
return ;
};
## Toolbar
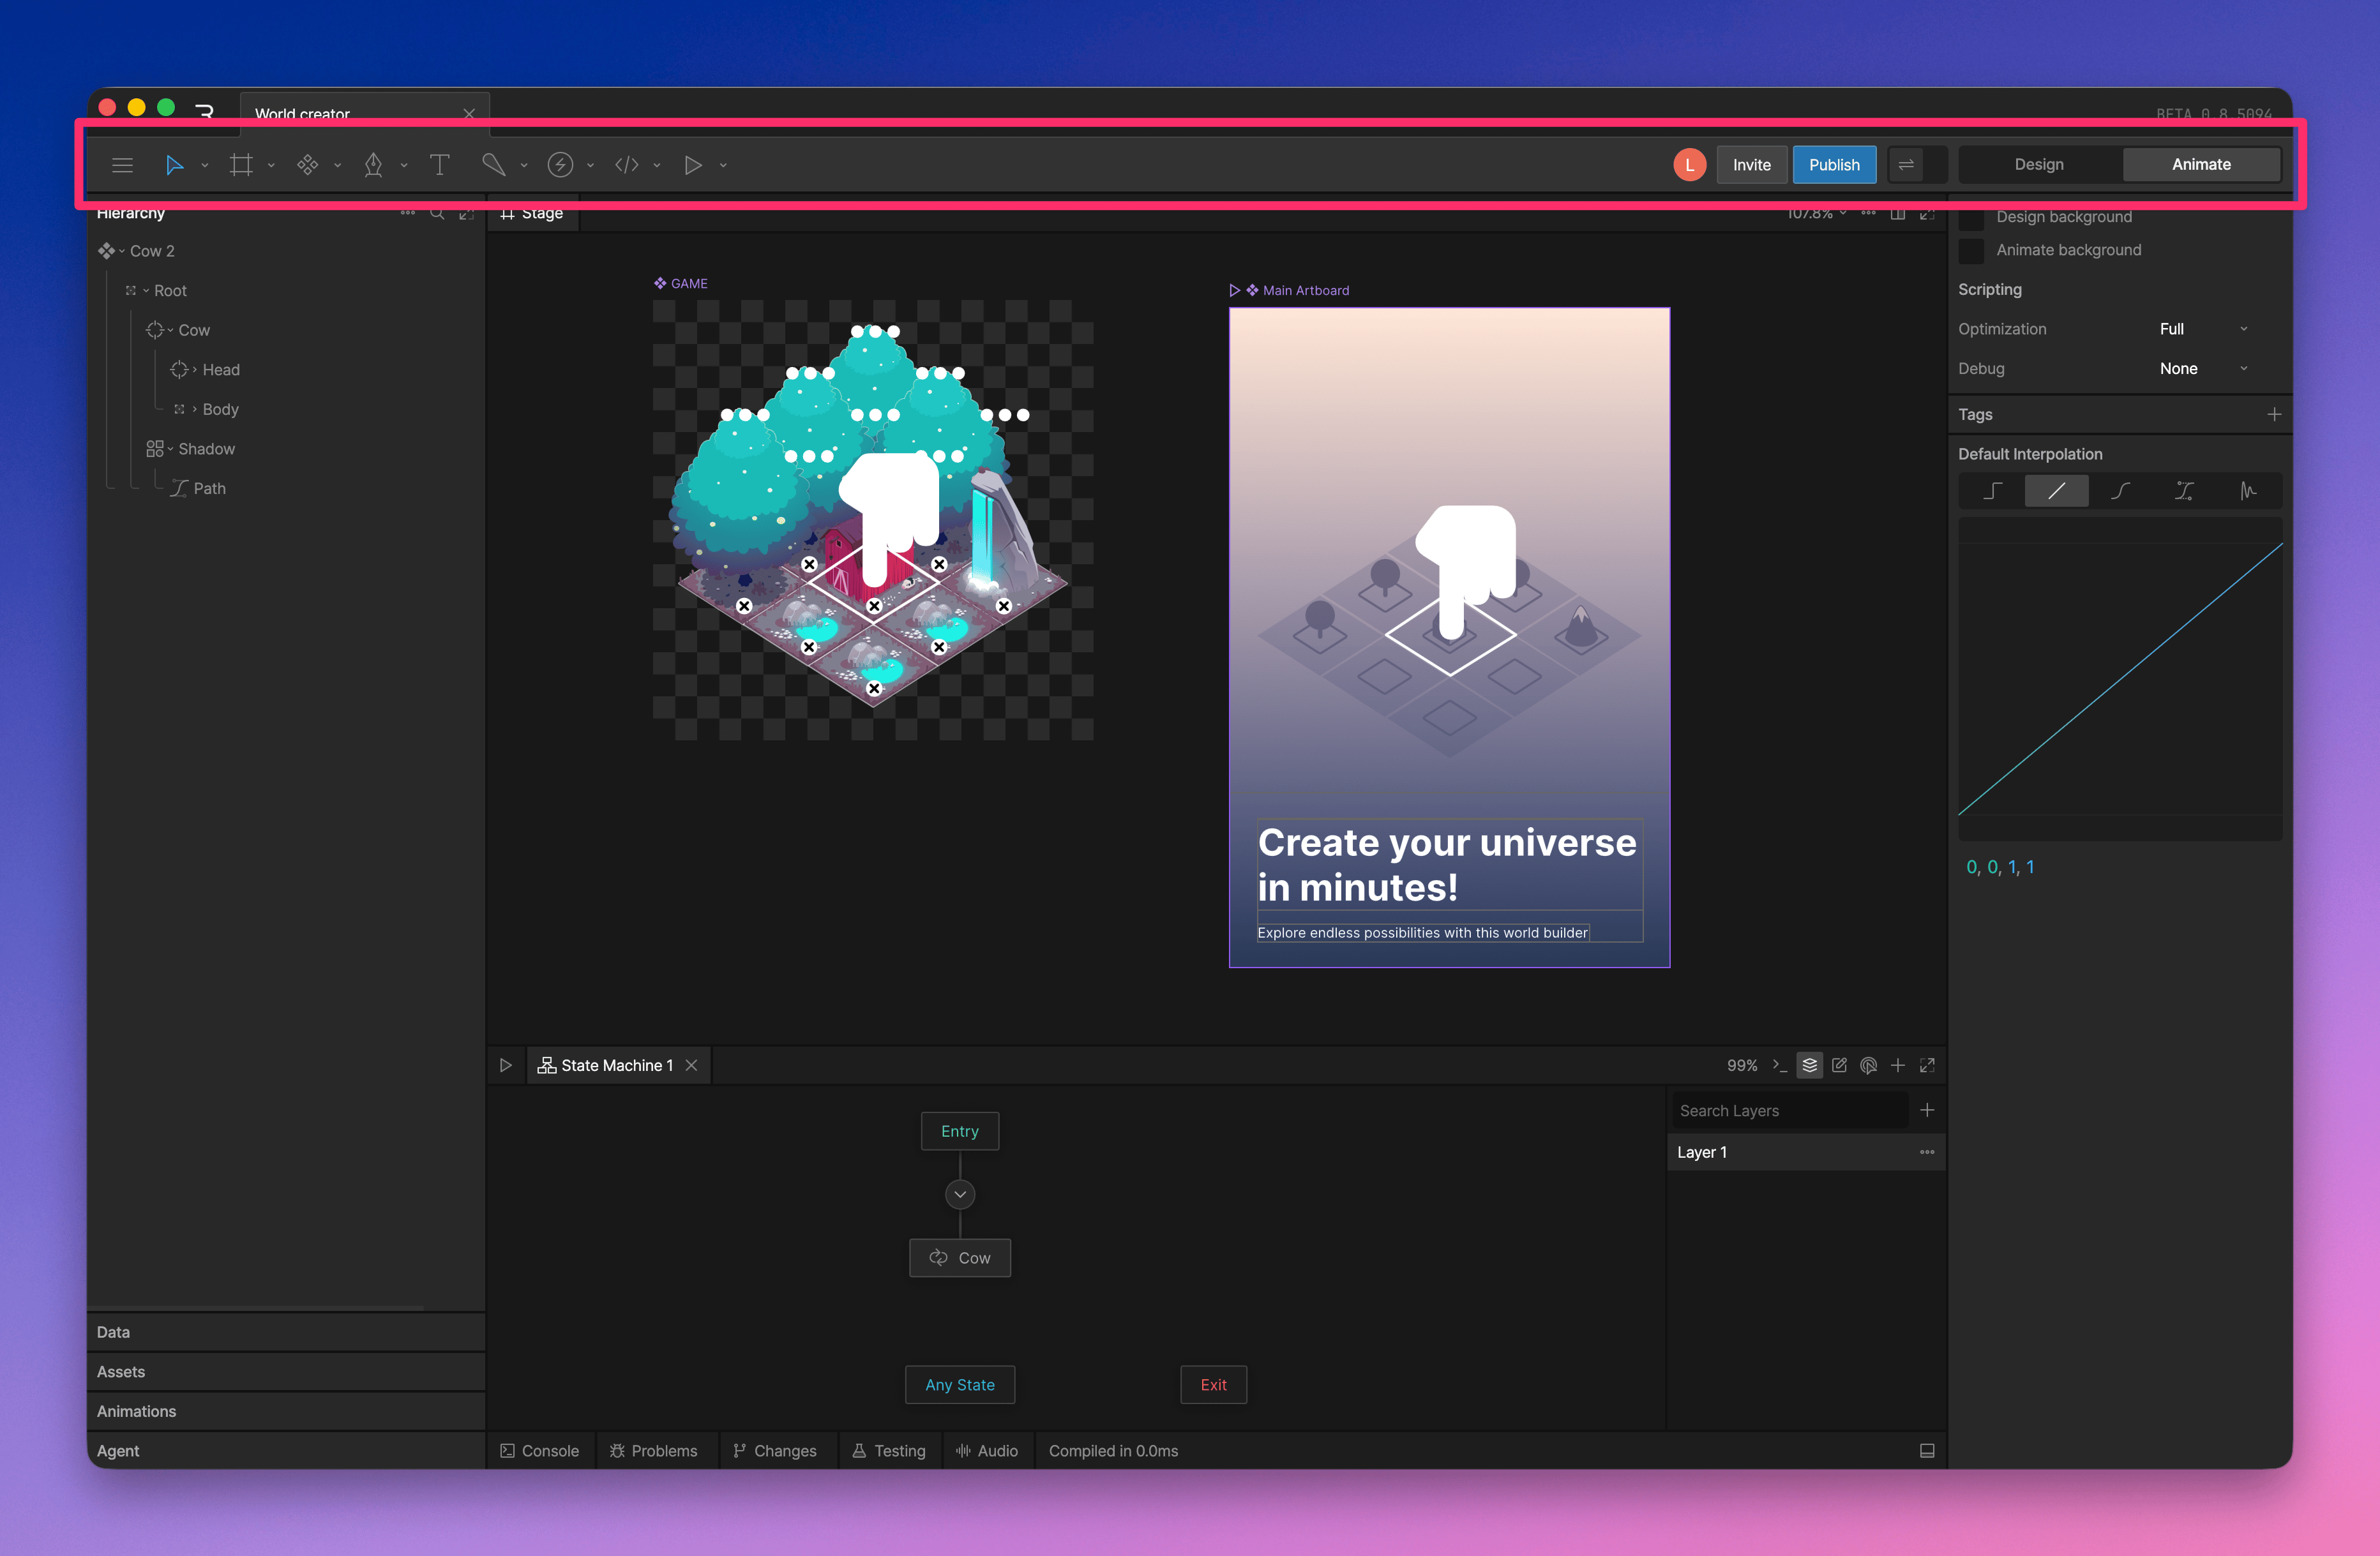 The Toolbar displays the tools you have available to create, rig, and manipulate items on the stage. In addition to these tools, the Toolbar houses a variety of options to allow you to customize the look of your file, set your main artboard, and export or share your file.
Read more on the [Toolbar page](/editor/interface-overview/toolbar).
## Sidebar
The Toolbar displays the tools you have available to create, rig, and manipulate items on the stage. In addition to these tools, the Toolbar houses a variety of options to allow you to customize the look of your file, set your main artboard, and export or share your file.
Read more on the [Toolbar page](/editor/interface-overview/toolbar).
## Sidebar
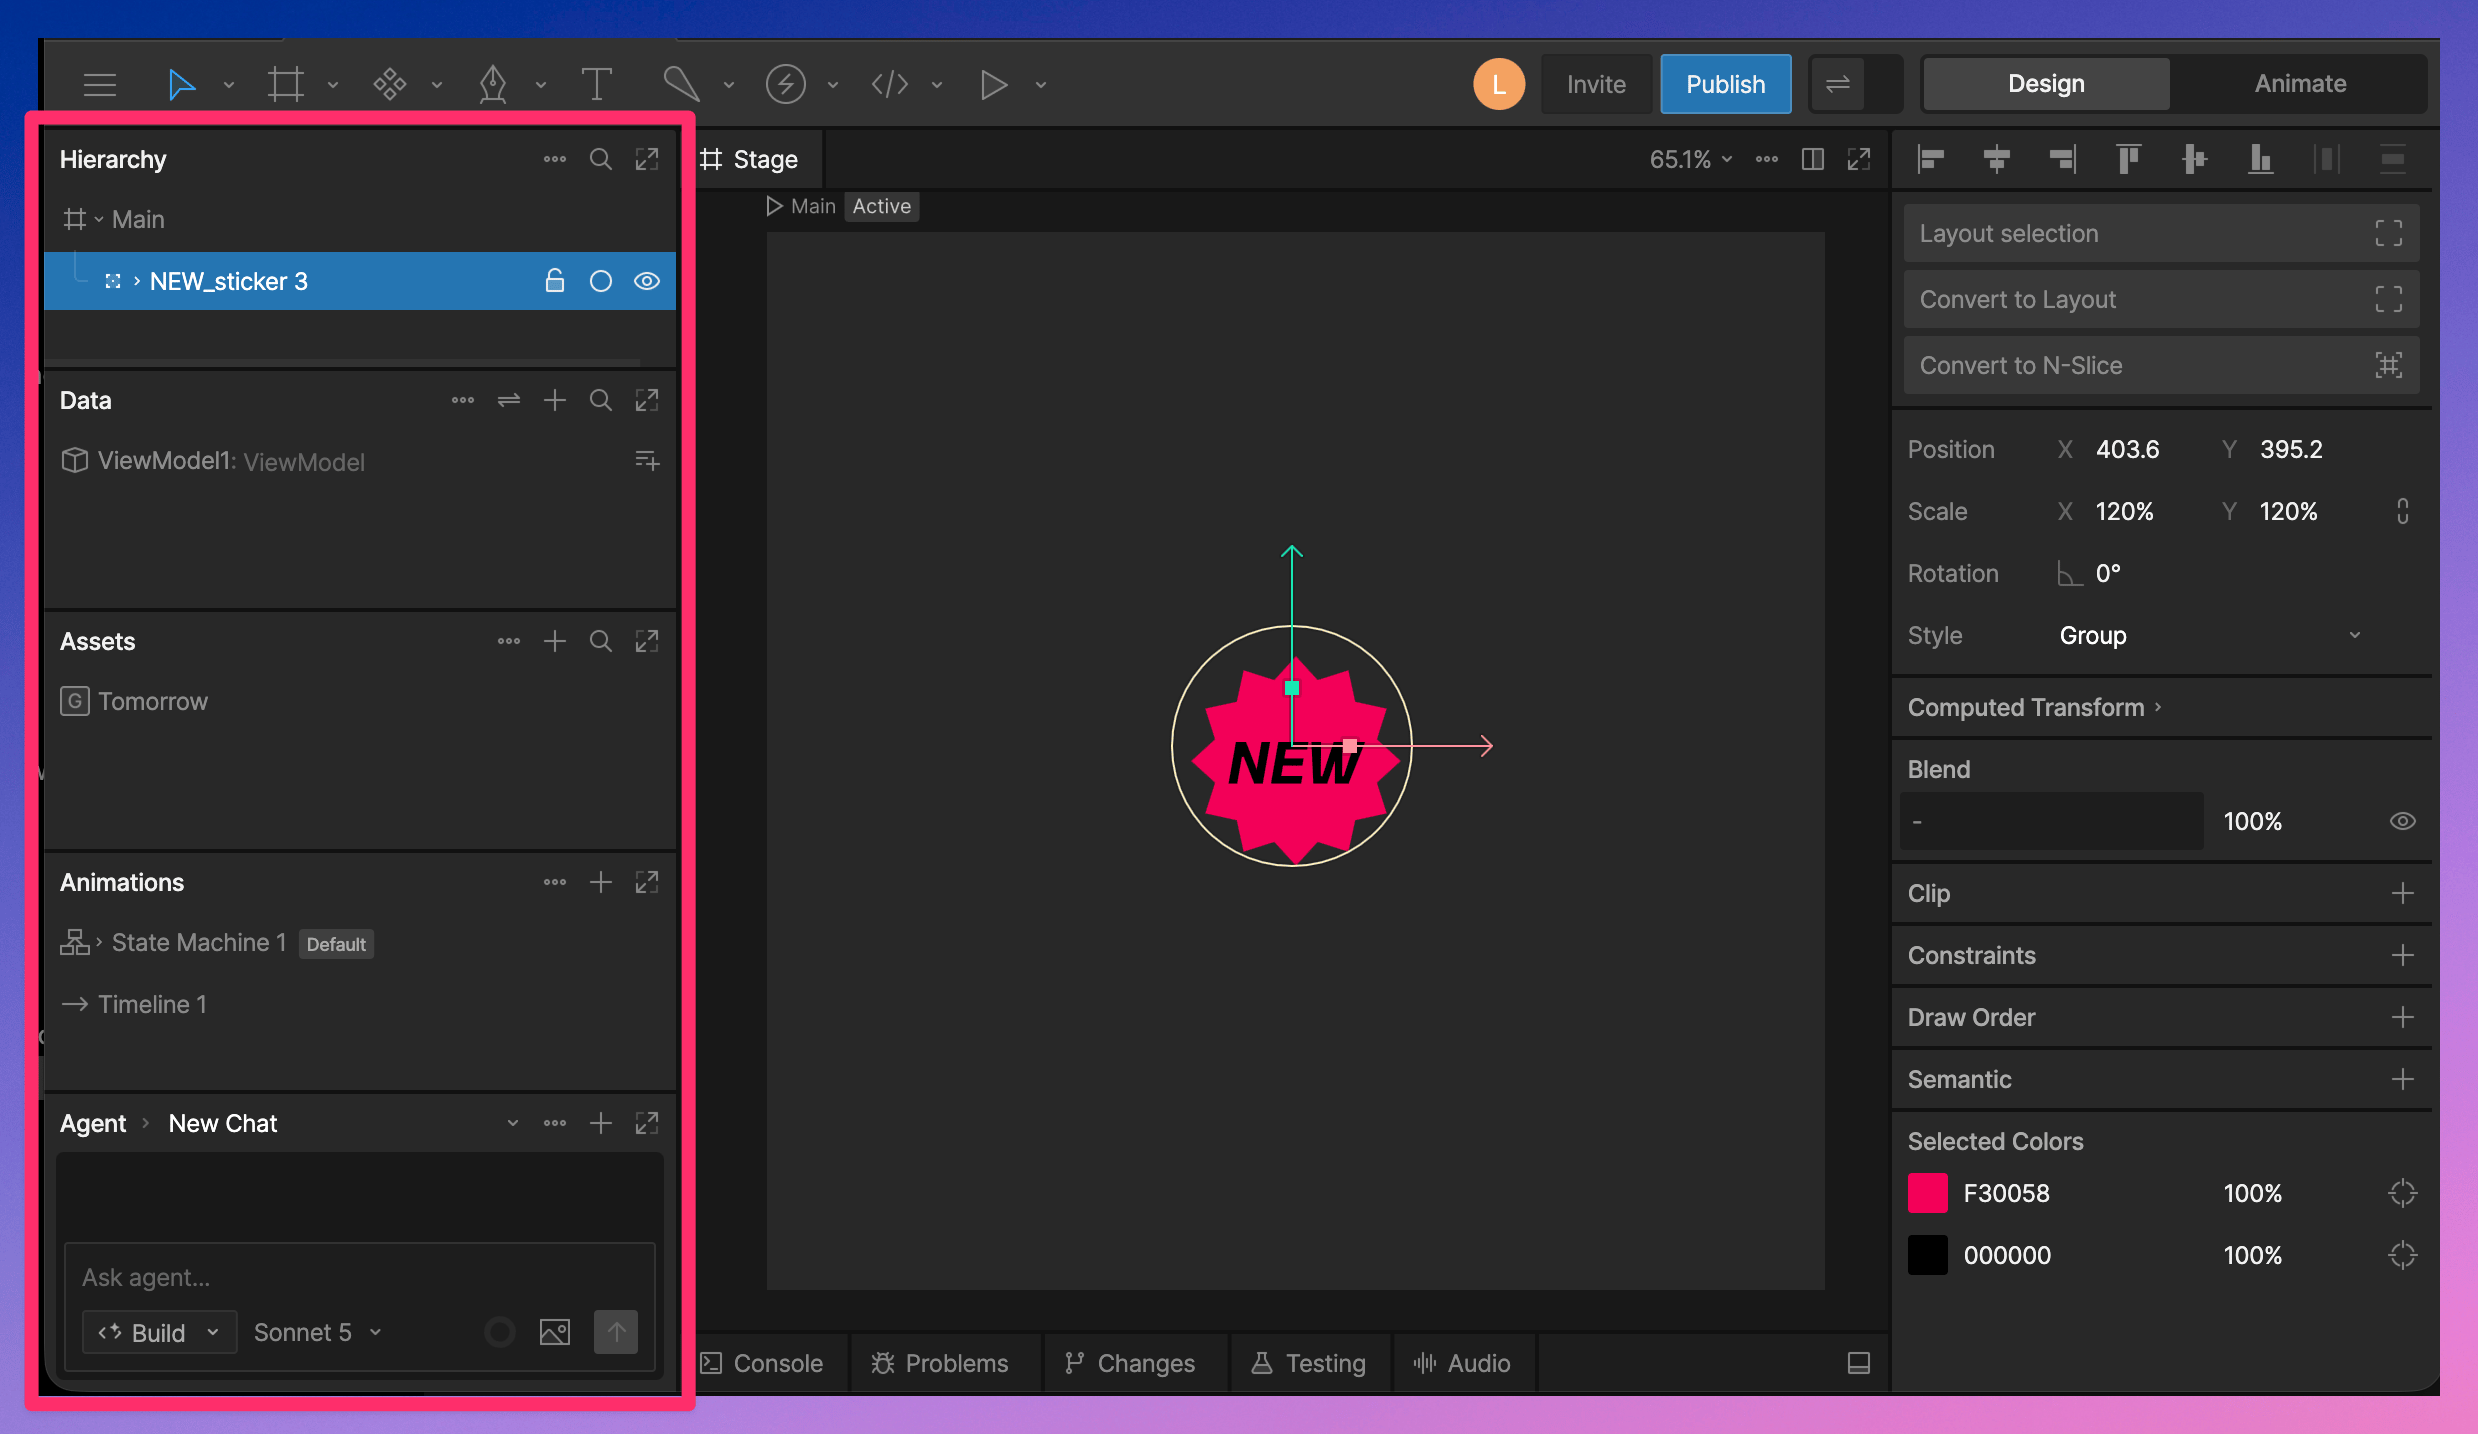 The sidebar is the left side of the editor. It contains panels for navigating your file, managing assets, working with data, editing animations, and using the AI Agent.
Read more on the [Sidebar page](/editor/interface-overview/sidebar).
## Inspector
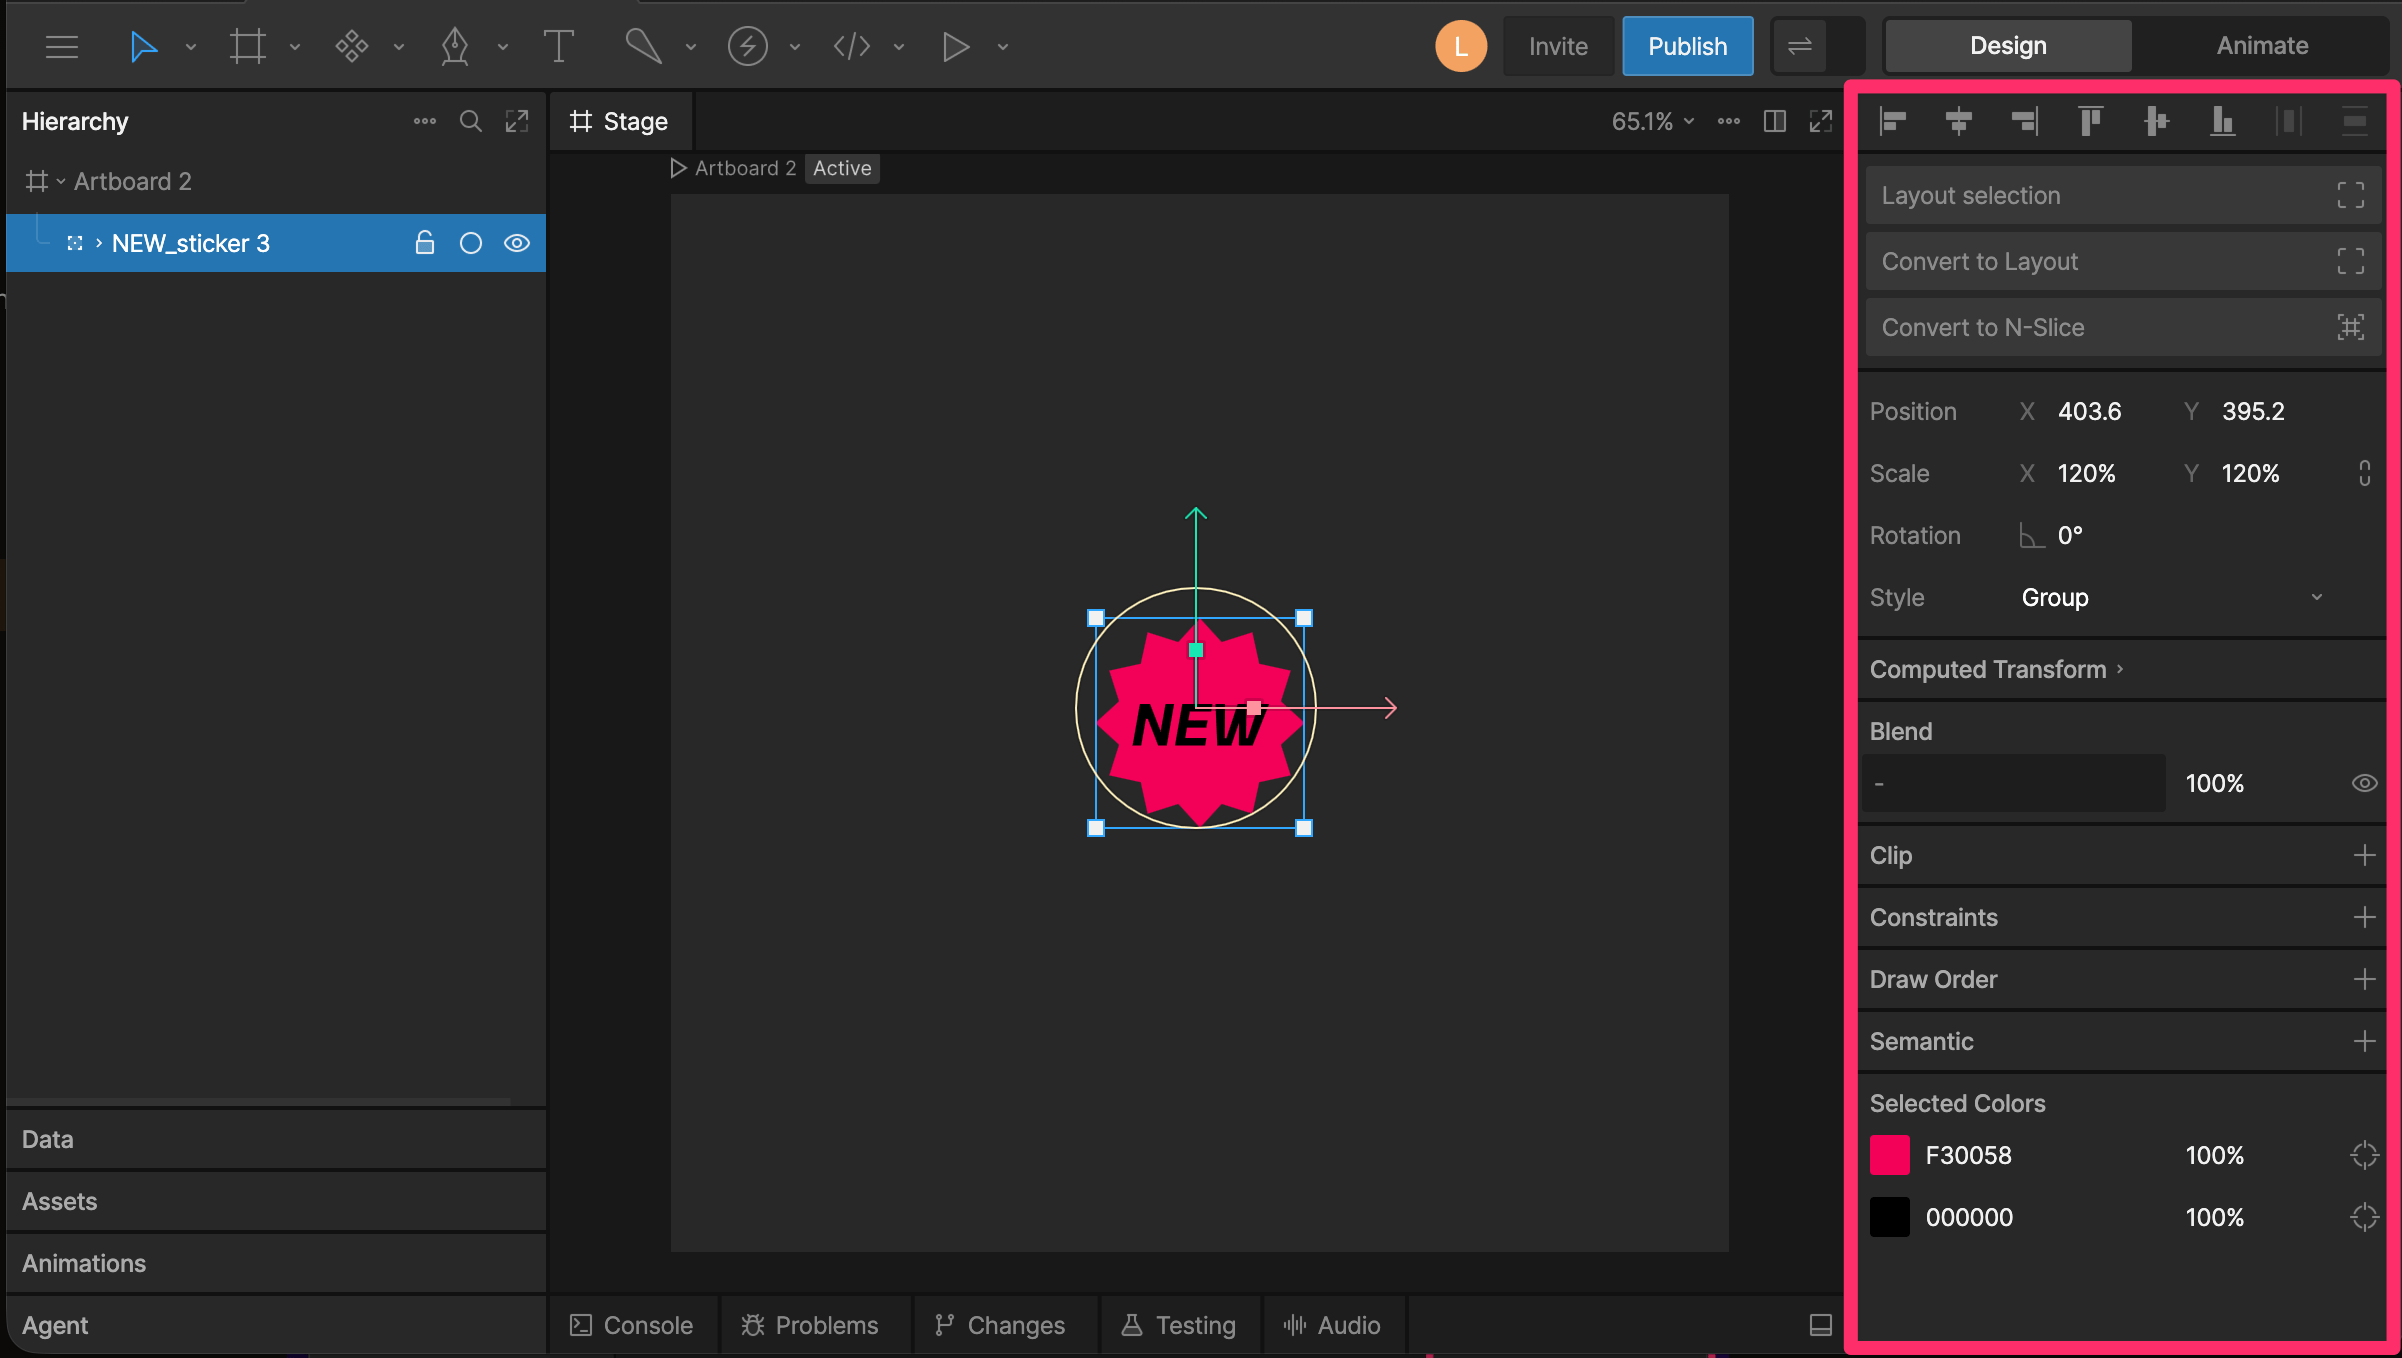
The Inspector is the right sidebar in the editor. It shows the available properties and options for the current selection.
The sidebar is the left side of the editor. It contains panels for navigating your file, managing assets, working with data, editing animations, and using the AI Agent.
Read more on the [Sidebar page](/editor/interface-overview/sidebar).
## Inspector
The Inspector is the right sidebar in the editor. It shows the available properties and options for the current selection.
 Read more on the [Inspector page](/editor/interface-overview/inspector).
## Viewport
Read more on the [Inspector page](/editor/interface-overview/inspector).
## Viewport
 The Viewport is the central area between the Toolbar, Sidebar, and Inspector. It can display the Stage, scripts, and other panels.
The Stage is where you create and edit artboards, which contain the designs and animations in your Rive file.
Read more on the [Viewport page](/editor/interface-overview/stage).
## Timeline
The Viewport is the central area between the Toolbar, Sidebar, and Inspector. It can display the Stage, scripts, and other panels.
The Stage is where you create and edit artboards, which contain the designs and animations in your Rive file.
Read more on the [Viewport page](/editor/interface-overview/stage).
## Timeline
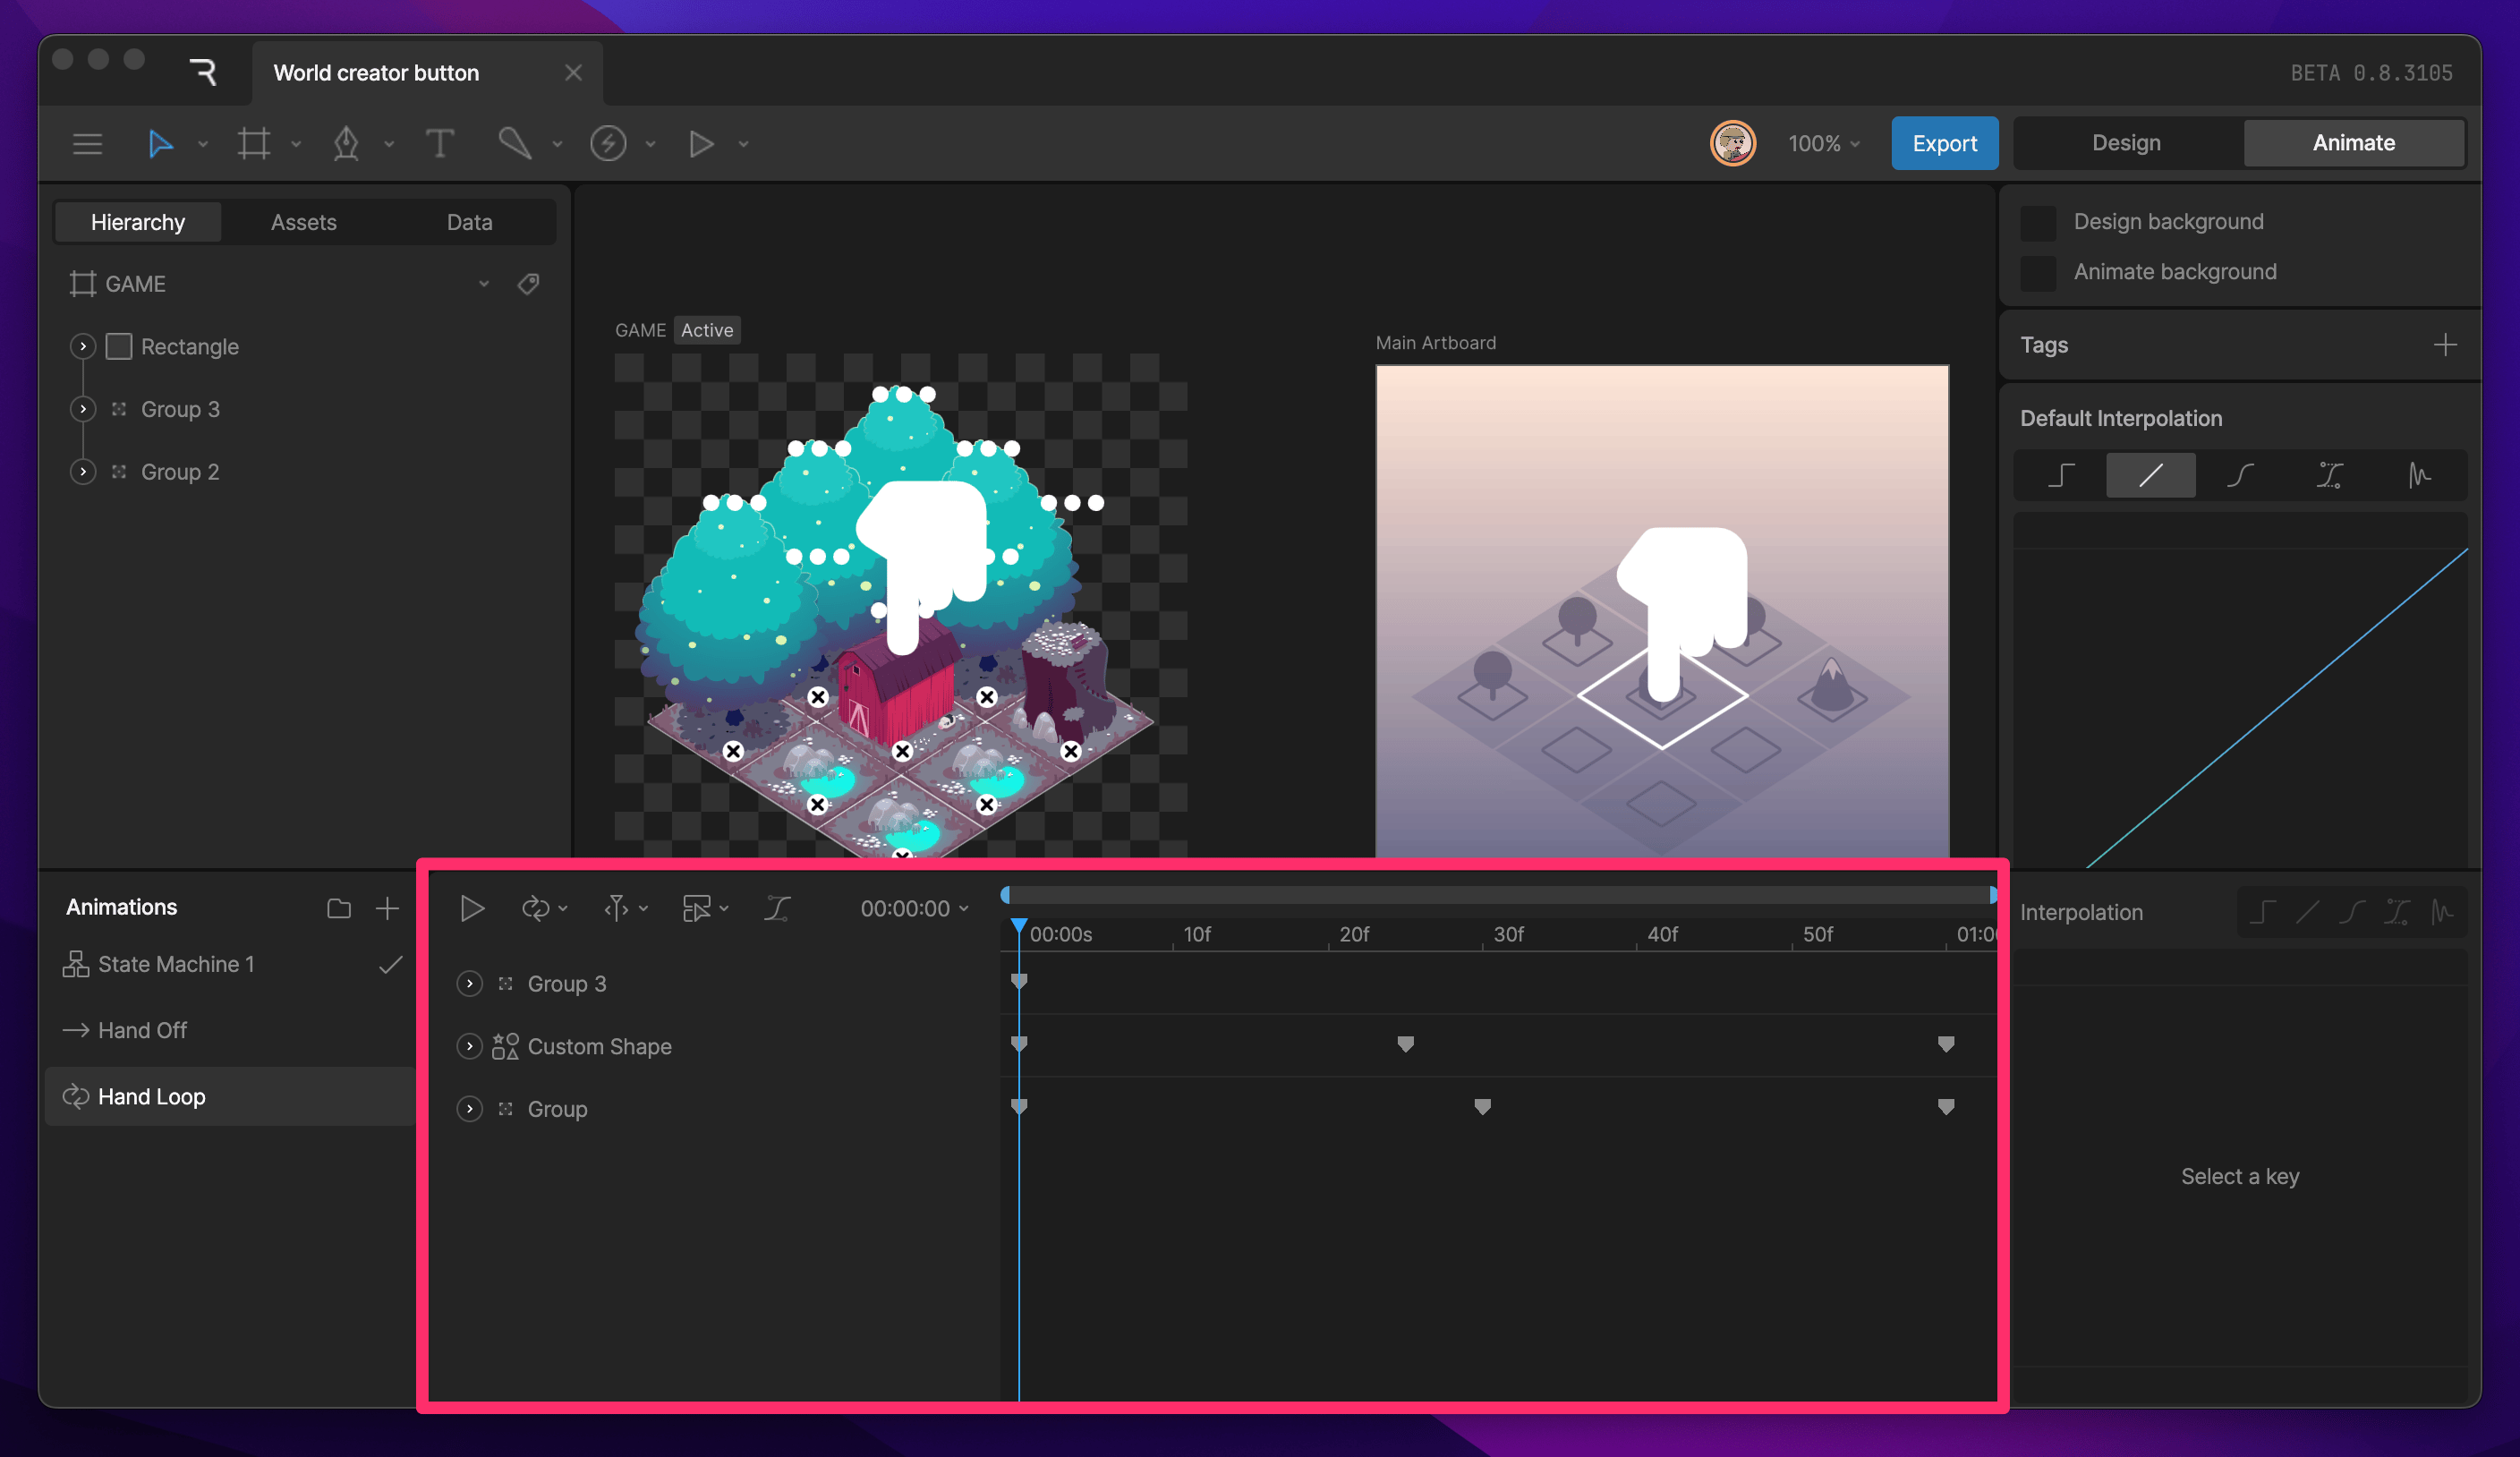 The Timeline surfaces from the bottom of the screen upon entering [animate mode](/editor/fundamentals/design-vs-animate-mode). Here you can create new states, access playback controls, settings, and set keyframes for object parameters. Select a timeline from the left-hand list to switch between the respective timelines.
Read more on the [Timeline page](/editor/fundamentals/design-vs-animate-mode).
## State Machine graph
The Timeline surfaces from the bottom of the screen upon entering [animate mode](/editor/fundamentals/design-vs-animate-mode). Here you can create new states, access playback controls, settings, and set keyframes for object parameters. Select a timeline from the left-hand list to switch between the respective timelines.
Read more on the [Timeline page](/editor/fundamentals/design-vs-animate-mode).
## State Machine graph
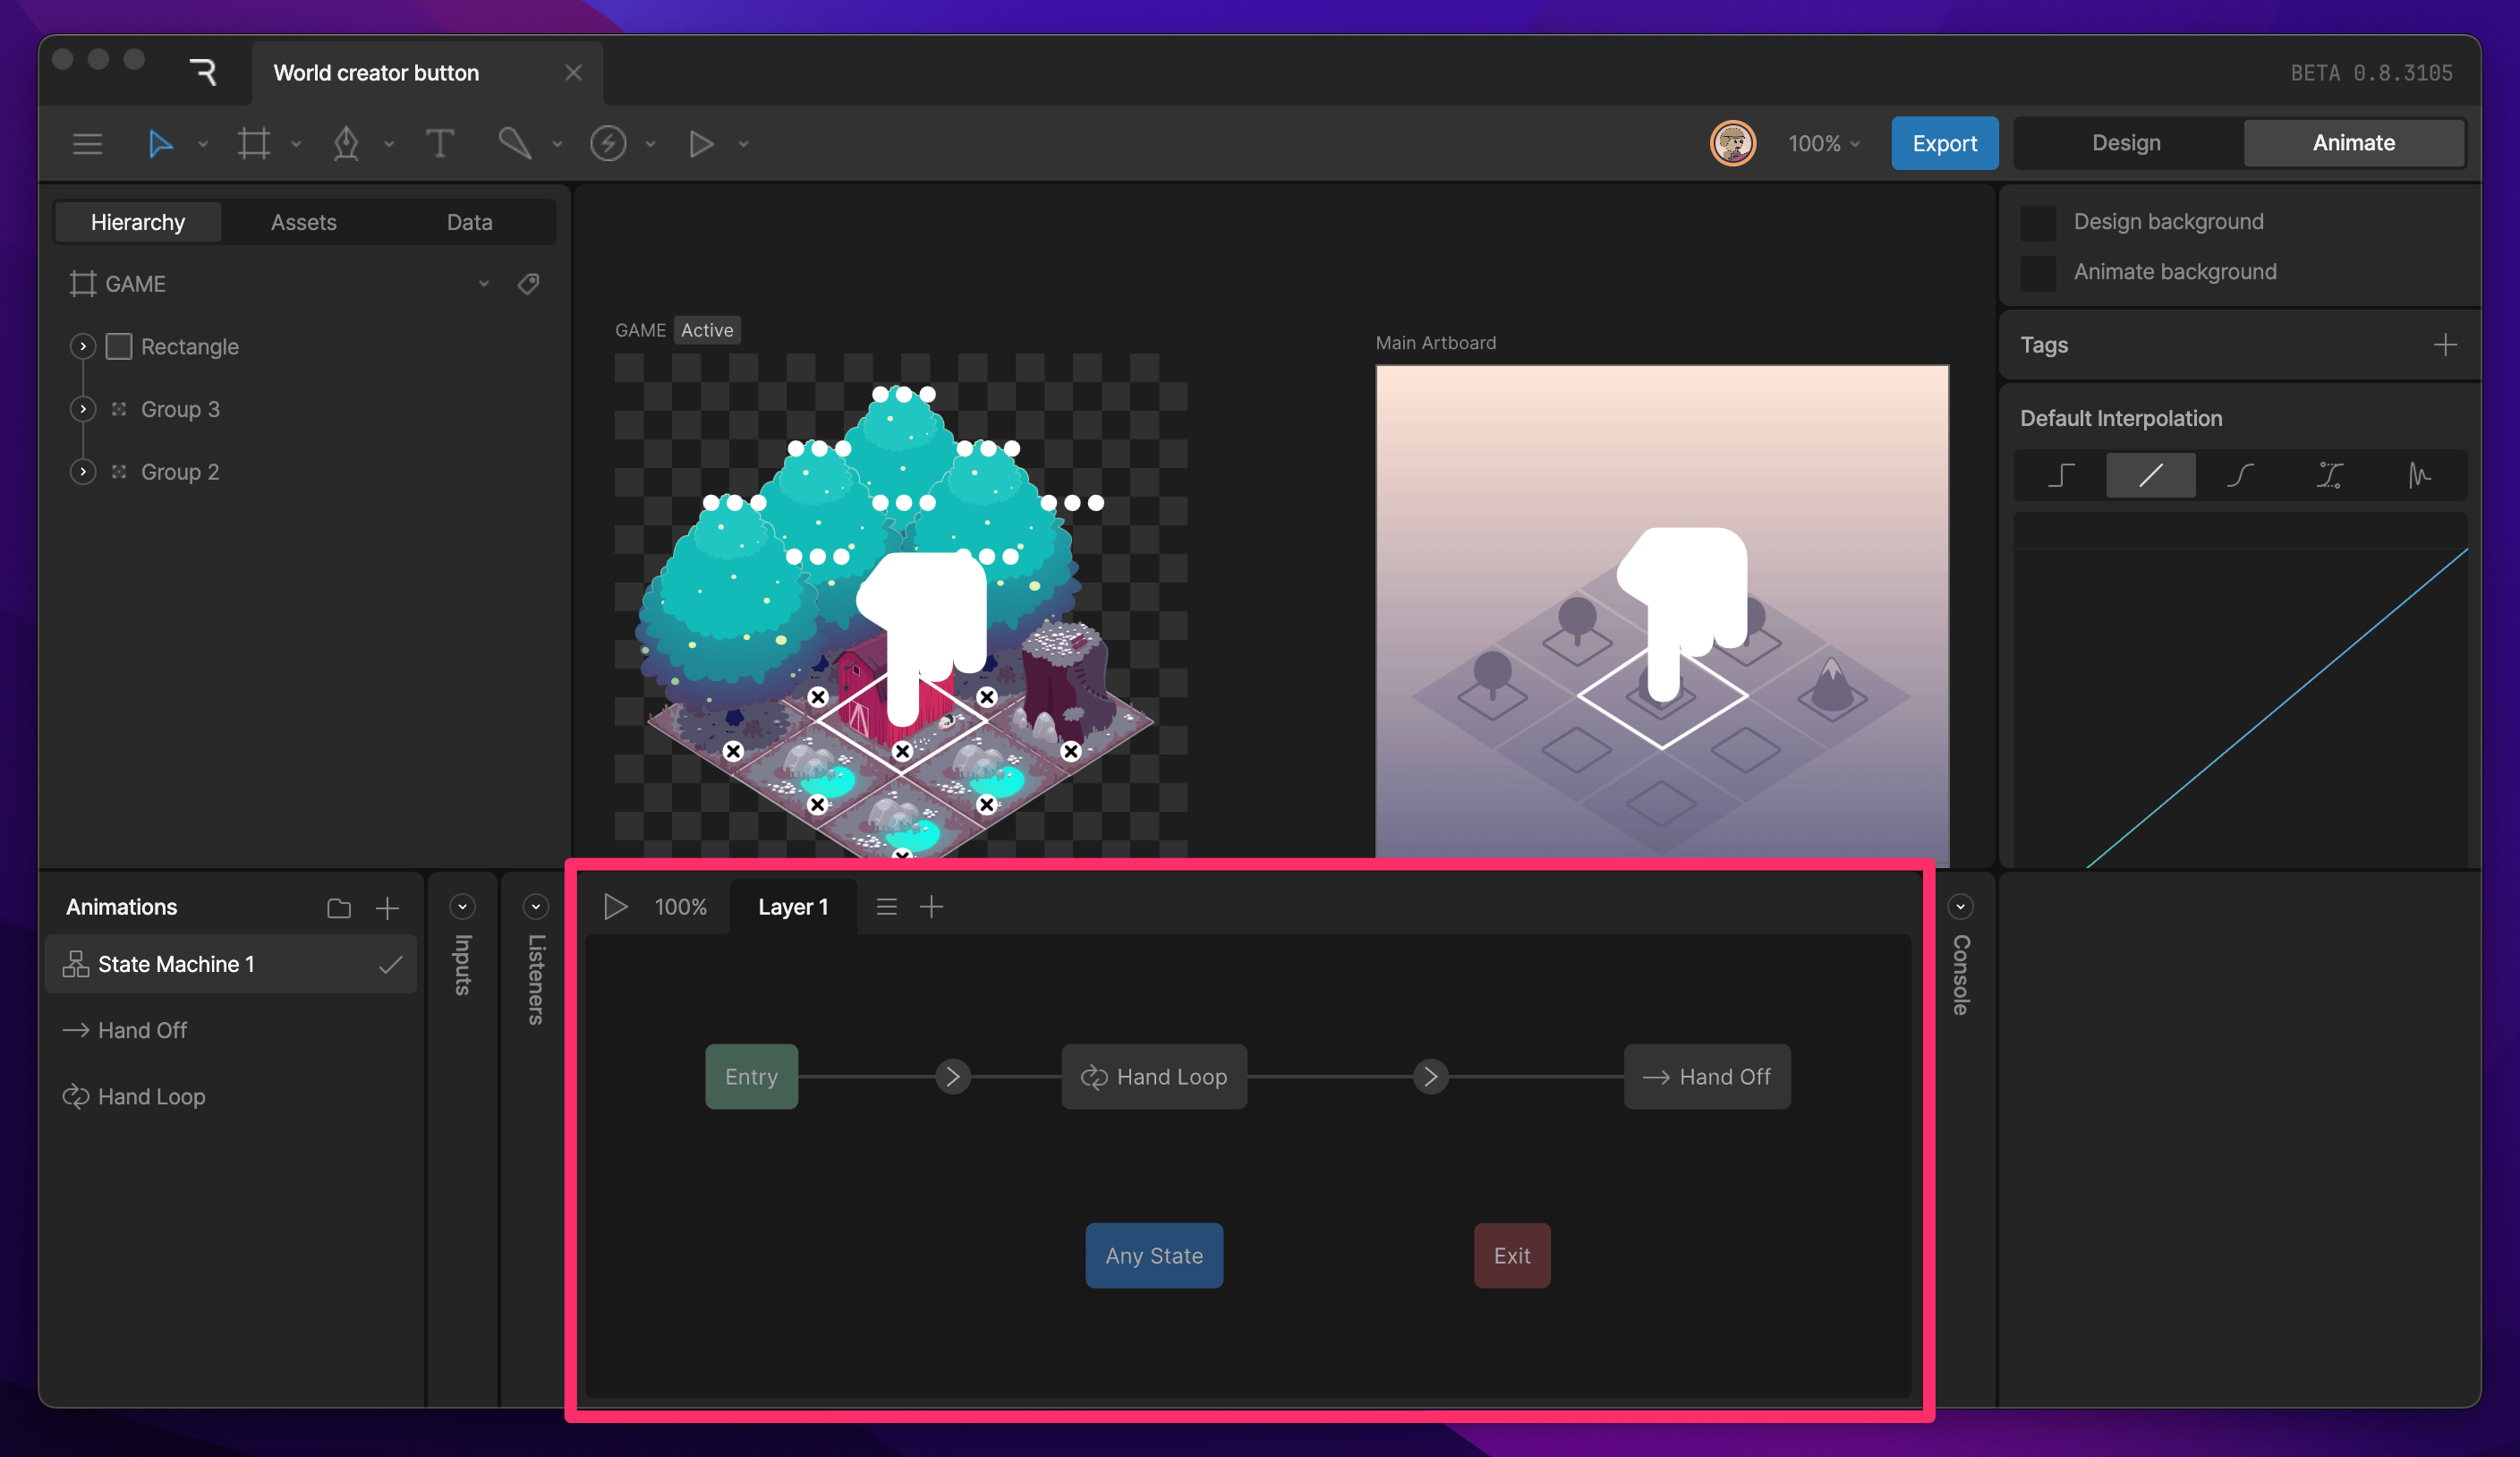 When a state machine is selected, the Timeline is replaced by a graph. This is where you'll be working on the state machine.
Read more on the [State Machine page](/editor/state-machine/state-machine).
## Debug Panel
When a state machine is selected, the Timeline is replaced by a graph. This is where you'll be working on the state machine.
Read more on the [State Machine page](/editor/state-machine/state-machine).
## Debug Panel
